


Graphical Abstract
Jain, S., R. Chhin, R. M. Doherty, S. K. Mishra, and S. Yoden, 2021: A new graphical method to diagnose the impacts of model changes on climate sensitivity. J. Meteor. Soc. Japan, 99, 437-448.
https://doi.org/10.2151/jmsj.2021-021
Graphical Abstract
Published
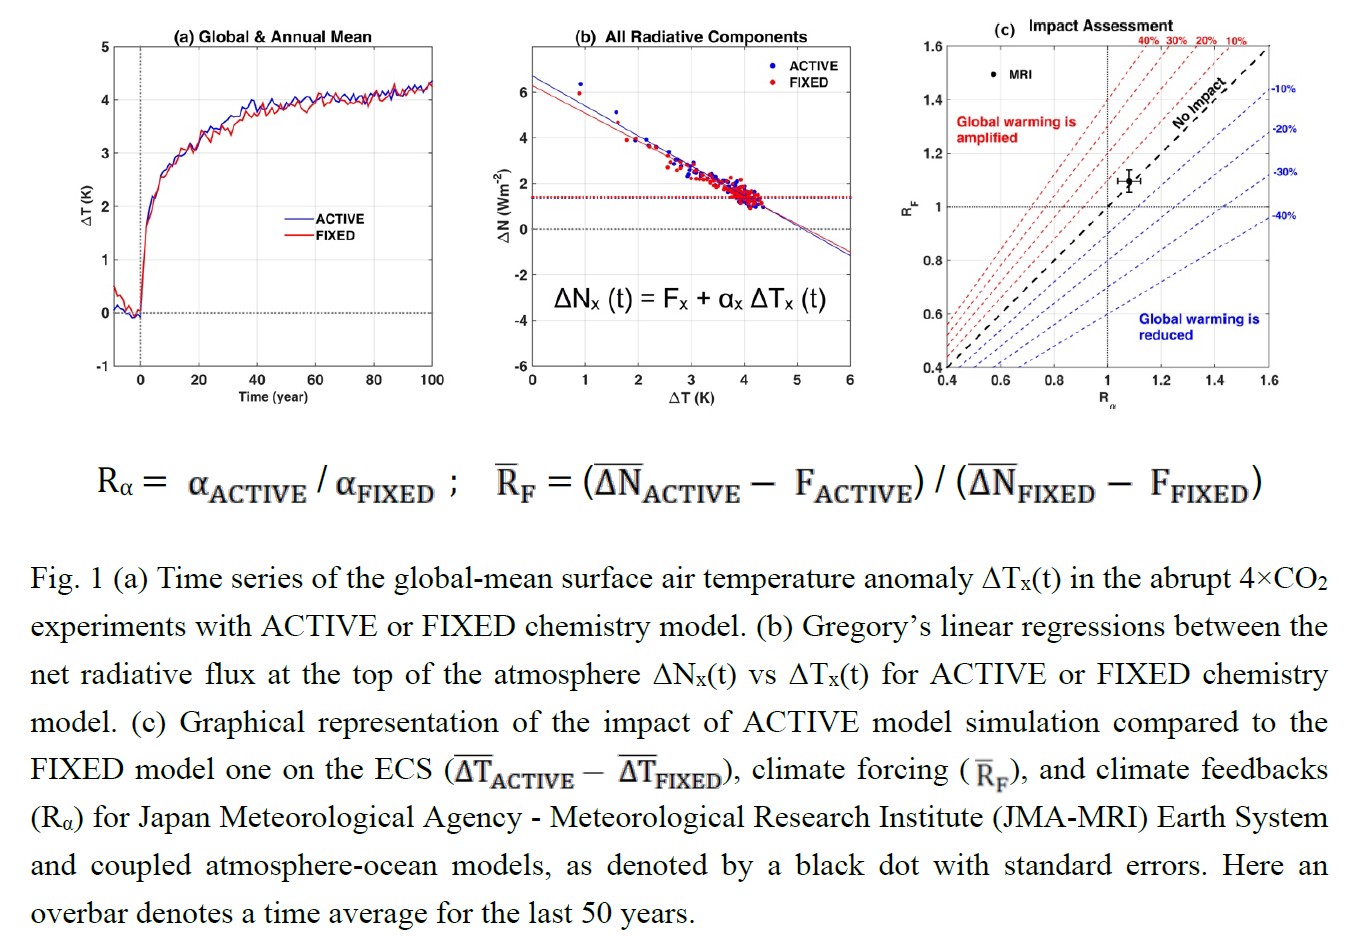
Plain Language Summary: Equilibrium climate sensitivity (ECS) is defined as the change in global-mean surface air temperature (ΔT) due to the quadrupling of CO2 in a climate model simulation (Fig.1a). In this paper, we propose a new graphical method, which is based on Gregory’s linear regressions (Fig.1b), to visualize the impact of a model change on ECS, climate forcing (RF), and feedbacks (Rα) in a single diagram (Fig.1c), and demonstrate its usefulness with an example of climate sensitivity simulations with interactive (ACTIVE) and prescribed (FIXED) chemistry model.
Highlights:
- Using this visualization method, one can quantify (a) whether the model-change amplifies, or reduces the global warming, and evaluate (b) the percentage changes in ECS (ΔT), climate forcing (RF), and climate feedbacks (Rα), and (c) ranges of the uncertainties in the estimated changes.
- This method can also be used to examine the spread in ECS, climate forcing, and climate feedbacks with respect to the multi-model mean (or one benchmark model) for multi-model frameworks like Coupled Model Intercomparison Project Phase 5/6 (CMIP5/6).