Graphical Abstract
JMSJ, 2014, Vol. 92, No. 5 (October)
Articles
Noda (2014)
Noda, A., 2014: Generalized transformed Eulerian mean (GTEM) description for Boussinesq fluids. J. Meteor. Soc. Japan, 92, 411-431.
http://dx.doi.org/10.2151/jmsj.2014-501
Graphical Abstract
Highlights:
- A generalized transformed Eulerian mean (GTEM) set of equations is derived based on a nonneutral (unstable/dissipative) wave under dissipation and/or diabatic heating conditions in a Boussinesq stratified fluid.
- The key quantity that characterizes the GTEM is the eddy diffusion tensor. The conventional transformed Eulerian means (TEMs) are shown to be based on simplified forms of the antisymmetric components of the eddy diffusion tensor in the framework of the GTEM. The full components are derived based on the waveform. However, the explicit form of the wave frequency and wavenumber of eddies is not referred to so as to apply the GTEM to actual atmospheric and oceanic data analyses.
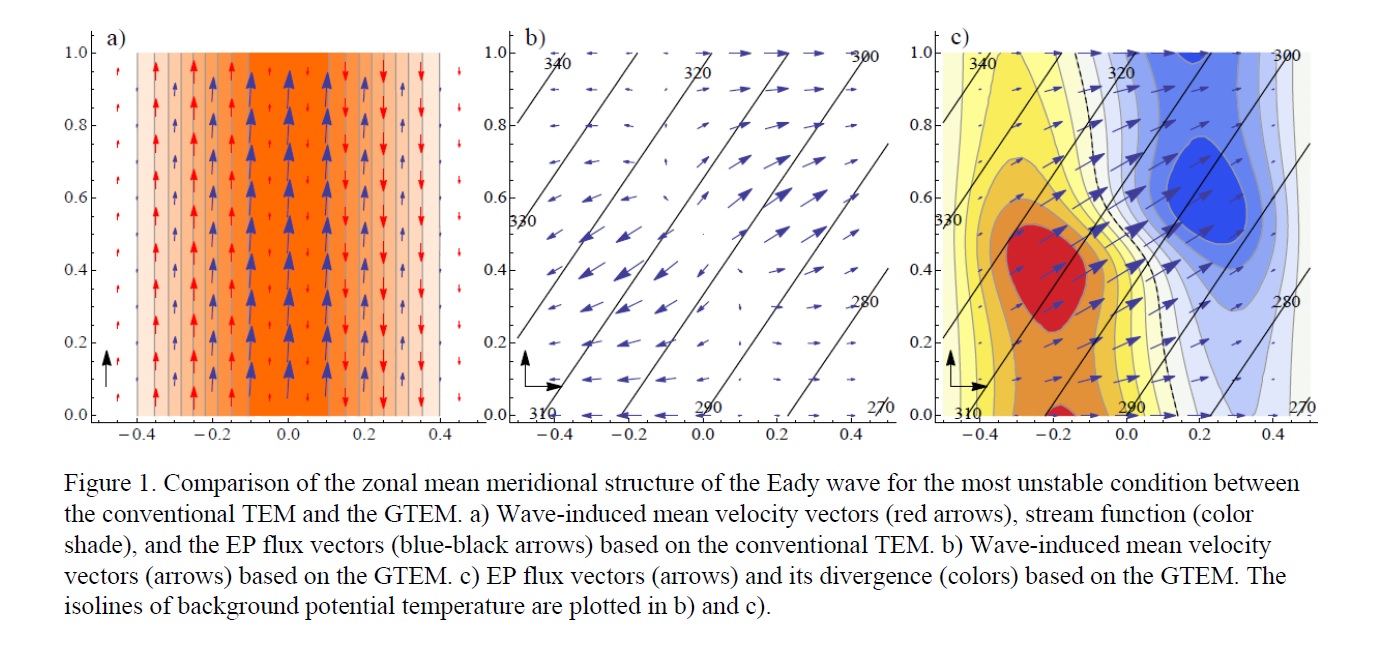
- The wave-induced transport velocity, which is defined as the divergence of the eddy diffusion tensor, is nondivergent by definition for that originated from the antisymmetric components, but divergent in general for that originated from the symmetric components. The focal mechanism that induces the difference and the Lagrangian mean motion, i.e., the Stokes drift defined in the generalized Lagrangian mean (GLM), is illustrated by figures.
- The Eliassen-Palm flux is originally defined in terms of the covariance of velocity and pressure perturbations and has a clear physical meaning of the wave momentum transport via group velocity for the waves that satisfy appropriate conditions in the GTEM formulation. However, it can be calculated as the residual of the Reynolds stress minus other terms relevant to the eddy diffusion tensor.
- An application to the Eady unstable wave is made to illustrate the differences between TEM, GLM, and GTEM, and the importance of the symmetric part of the eddy diffusion tensor (Fig. 1).
Jin et al. (2014)
Jin, Y., K. Kai, H. Okamoto, and Y. Hagihara, 2014: Improvement of CALIOP cloud masking algorithms for better estimation of dust extinction profiles. J. Meteor. Soc. Japan, 92, 433-455.
http://dx.doi.org/10.2151/jmsj.2014-502
Graphical Abstract
Highlights:
- Misclassification of dust as clouds in the CALIOP cloud mask (C2) is improved. Strong signals from dust storms lead to misclassify dust into clouds (Fig. 1(a) and 1(b)). Using a linear discriminant function (LDF), misclassified clouds are successfully discriminated (Fig. 1(c)) and resulting data mask correctly classifies the misclassified clouds into dust (Fig. 1(d)).
- The cloud mask is most frequently misclassified in the Taklimakan Desert. The proportion of misclassified clouds to the totally observed dust (dust + misclassified clouds) is ∼34.6%.
- Dust extinction profiles are investigated after the cloud mask improvement. Comparison of our results with CALIOP level 3 products indicates that the extinction profile using the improved cloud mask (C2’) is up to twice larger than that of CALIOP level 3 products (Fig. 2) in the Taklimakan Desert.
Oue et al. (2014)
Oue, M., K. Inagaki, T. Shinoda, T. Ohigashi, T. Kouketsu, M. Kato, K. Tsuboki, and H. Uyeda, 2014: Polarimetric Doppler radar analysis of organization of a stationary rainband with changing orientations in July 2010. J. Meteor. Soc. Japan, 92, 457-481.
http://dx.doi.org/10.2151/jmsj.2014-503
Graphical Abstract
Highlights:
- Polarimetric Doppler radar analysis revealed organization processes of a stationary rainband, of which the orientation was initially southwest–northeast (Period A, Figures 1a and 1b), but changed to west-southwest to east-northeast (Period B, Figures 1c and 1d), before reverting to its original orientation (Period C, Figures 1e and 1f).
- The rainband orientations were determined by the travel directions of the convective cells and the positions of cell generation relative to the rainband (Figure 1), which in turn were governed by intensities of low-level inflow and cell-origin outflow (Figure 2).
- During Period A, convective cells formed over a wide area within the rainband and traveled northeastward by environmental southwesterly winds. During Period B, convective cells formed on the southern lateral side of the rainband and traveled north-northeastward with accompanying stronger south-southwesterly inflows and low-level outflows. During Period C, the outflows and south-southwesterly inflows then weakened, and convective cells formed successively on the southwestern edge of the rainband and moved to the northeast.
Zhang et al. (2014)
Zhang, S. J., X. Xu, S. Peng, W. Yao, and T. Koike, 2014: Three-dimensional variational data assimilation experiments for a heavy rainfall case in the downstream Yangtze River Valley using Automatic Weather Station and Global Positioning System data in southeastern Tibetan Plateau. J. Meteor. Soc. Japan, 92, 483-500.
http://dx.doi.org/10.2151/jmsj.2014-504
Graphical Abstract
Highlights:
- The relationship between the water vapor in the Tibetan Plateau (TP) region and the summer rainfall in the Yangtze River Valley (YRV) was investigated, focusing on the role of the “key sensitive area (KSA)” in the southeastern edge of the TP in transporting water vapor downstream (Figure 1).
- There existed high correlations between the moisture and precipitable water vapor (PWV) observed by the Automatic Weather Stations (AWS) and Global Positioning System (GPS) stations over the southeastern slope of the TP and the summer rainfall in the YRV (Figure 2), suggesting the former can be used as a good early-warning signal for the occurrence of the latter.
- The assimilation of observations from the AWS and GPS in the KSA helped to adjust the structures of moisture, temperature and wind fields, which improved the rainfall forecast in the YRV, especially the heavy rainfall event. This result suggests that the assimilation of early-warning signals in the KSA into the initial field may help to improve the prediction of rainfall in the YRV, especially for 2-3 day forecast.
- Both data analysis and numerical experiments demonstrated that the observations in the KSA improved the forecast of high-impact weather in the YRV.


